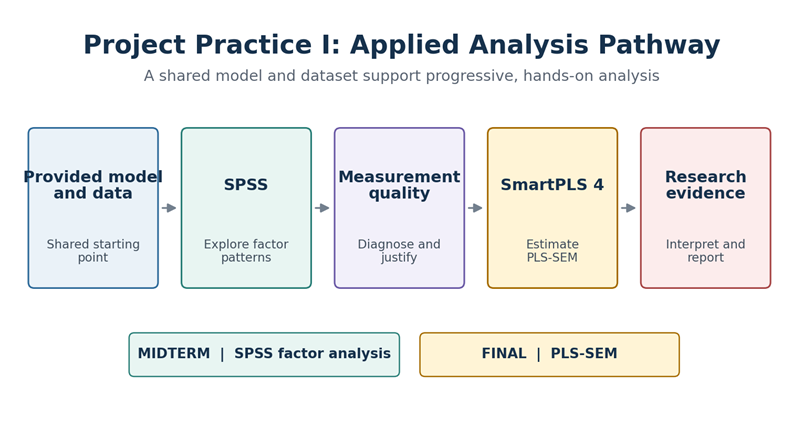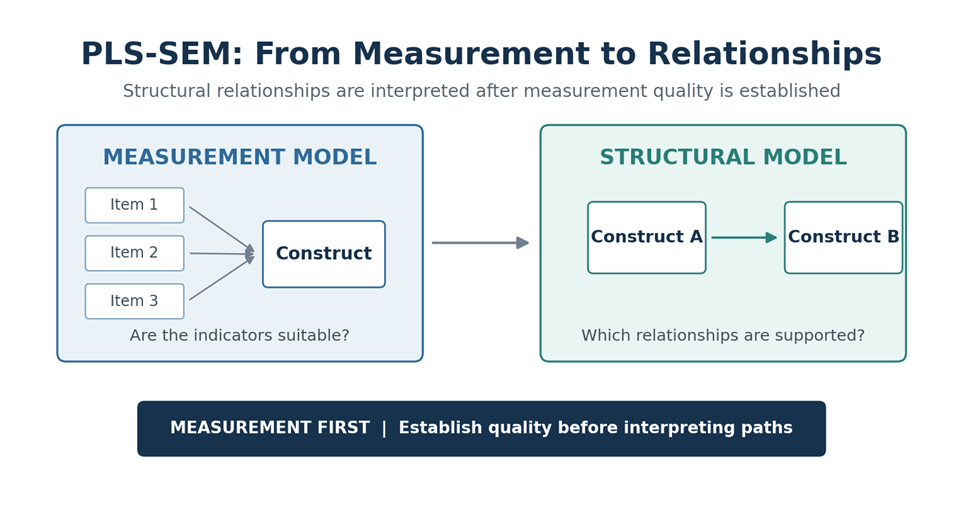

Project Practice I turns quantitative methods into a guided undergraduate research project. It is the first course in a two-semester sequence. During this semester, the research model and dataset are provided so that students can focus on analytical reasoning rather than beginning with data collection or model development. The course connects exploratory factor analysis in SPSS with partial least squares structural equation modeling (PLS-SEM) in SmartPLS 4. Students learn how the quality of indicators and constructs affects the credibility of conclusions drawn from relationships in a research model.
During the first half of the semester, students use SPSS to explore the measurement structure of supplied data. They run exploratory factor analysis and compare solutions produced by maximum likelihood, principal axis factoring, and principal component analysis under Promax rotation. The purpose is not to accept the first output that the software produces. Students inspect loading patterns, identify nonloading and cross-loading items, recognize when one item set contains more than one dimension, and examine how an analytical choice changes the solution. The midterm assesses this ability through repeated analysis and interpretation rather than through definitions alone.
Students also evaluate whether a measurement structure is defensible. They interpret the KMO measure, Bartlett's test, communalities, explained variance, primary and cross loadings, factor correlations, and Cronbach's alpha. Exercises address reverse-worded items, weak indicators, and constructs that separate into distinct dimensions. An item is not removed simply because one statistic improves. Students must consider its wording, conceptual role, and effect on the broader measurement structure. This combination of statistical and conceptual judgment helps prevent mechanical decisions that weaken the meaning of a construct.
The second half transitions from exploratory analysis to PLS-SEM in SmartPLS 4. Using the provided model and dataset, students learn to represent indicators and constructs, estimate the specified model, assess the measurement model, and interpret the relationships in the structural model. The final assessment is based on PLS-SEM. Students must run the analysis, identify the relevant results, apply the evaluation criteria taught in the course, and explain what the evidence supports. The emphasis is not on copying values from software output. Each result must lead to a clear and defensible analytical judgment.
The progression also clarifies the different roles of the two software environments. SPSS helps students explore item structure and diagnose measurement problems. SmartPLS 4 allows them to evaluate a specified PLS-SEM model and interpret relationships among constructs. Classroom demonstrations are followed by structured practice, repeated analysis, and discussion of alternative interpretations. Because all students begin with the same model and data, the class can compare decisions directly and examine why apparently small choices may change a conclusion.
By the end of Project Practice I, students should be able to use SPSS and SmartPLS 4 purposefully, evaluate measurement evidence, conduct a guided PLS-SEM analysis, and communicate results with appropriate caution. The course establishes the shared analytical foundation for Project Practice II without treating software output as a substitute for research reasoning.